
With a bit of research, I found my way of accomplishing this. Using a TMP36 - Analog Temperature sensor which i have available in my room, I set up a basic circuit seen above:
Then using code seen below from ardx.org. I got my circuit running. From here, I connected my raspberry pi through usb to the arduino. Using putty, to connect via SSH, I setup Raspberry to listen for data by opening up a terminal window, and typing:
pi@raspberrypi ~ $ python
>>> import serial
>>> ser = serial.Serial('/dev/ttyACM0', 9600)
>>> while 1:
... ser.readline()
...
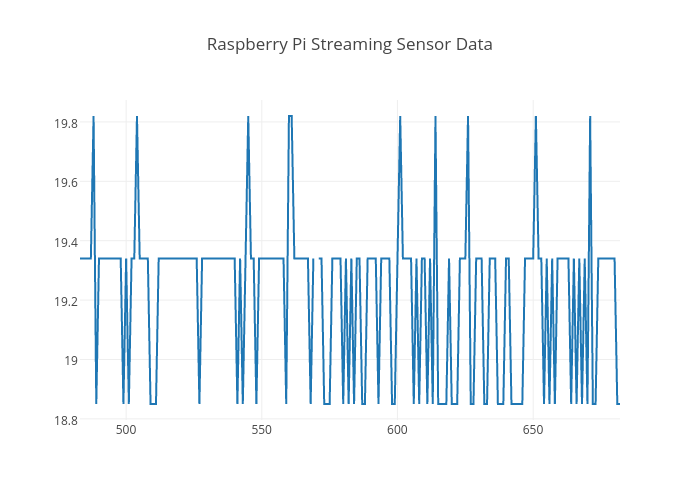
From there, you should see data listing showing you temperature values. Success! Now we need to use an API to graph the data online. I found plotly to be the easiest to use. I went to plotly. I actually found a nice tutorial by plotly on using the tmp36 sensor. Straight to the point, I signed up, obtained a username,API key, and a token, and some code to send the data over to plotly...
No comments:
Post a Comment